Introducing kepler.gl, Uber’s Open Source Geospatial Toolbox
Table of Contents
Created by Uber’s Visualization team, kepler.gl is an open source data agnostic, high-performance web-based application for large-scale geospatial visualizations. At Uber, we leverage data visualization to better understand how our cities move. Our solutions enable us to embed maps with rich location data, render millions of GPS points in the blink of an eye, and, most importantly, derive insights from them.
No matter the frameworks or tools used, creating interactive visualizations follows a similar process: data collection, data processing, visualization exploration via web-based tools such as QGIS, Carto, and Mapbox Studio, and then porting the visualizations into Javascript with React, D3.js, and Three.js to build prototypes. Not only is the process tedious, but it may or may not reap useful visualizations. In many cases, there are more visualization ideas than there is time and people to make them.
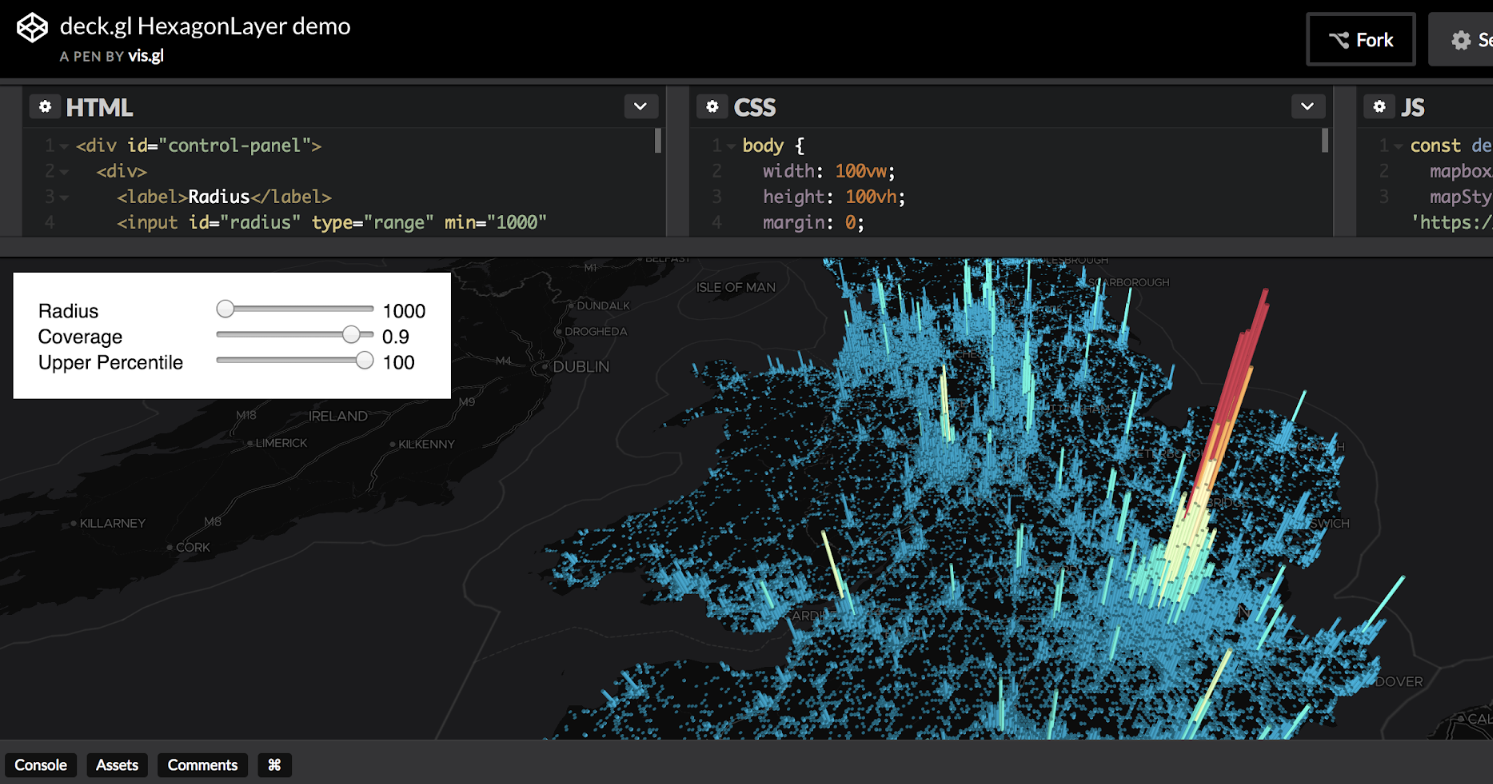
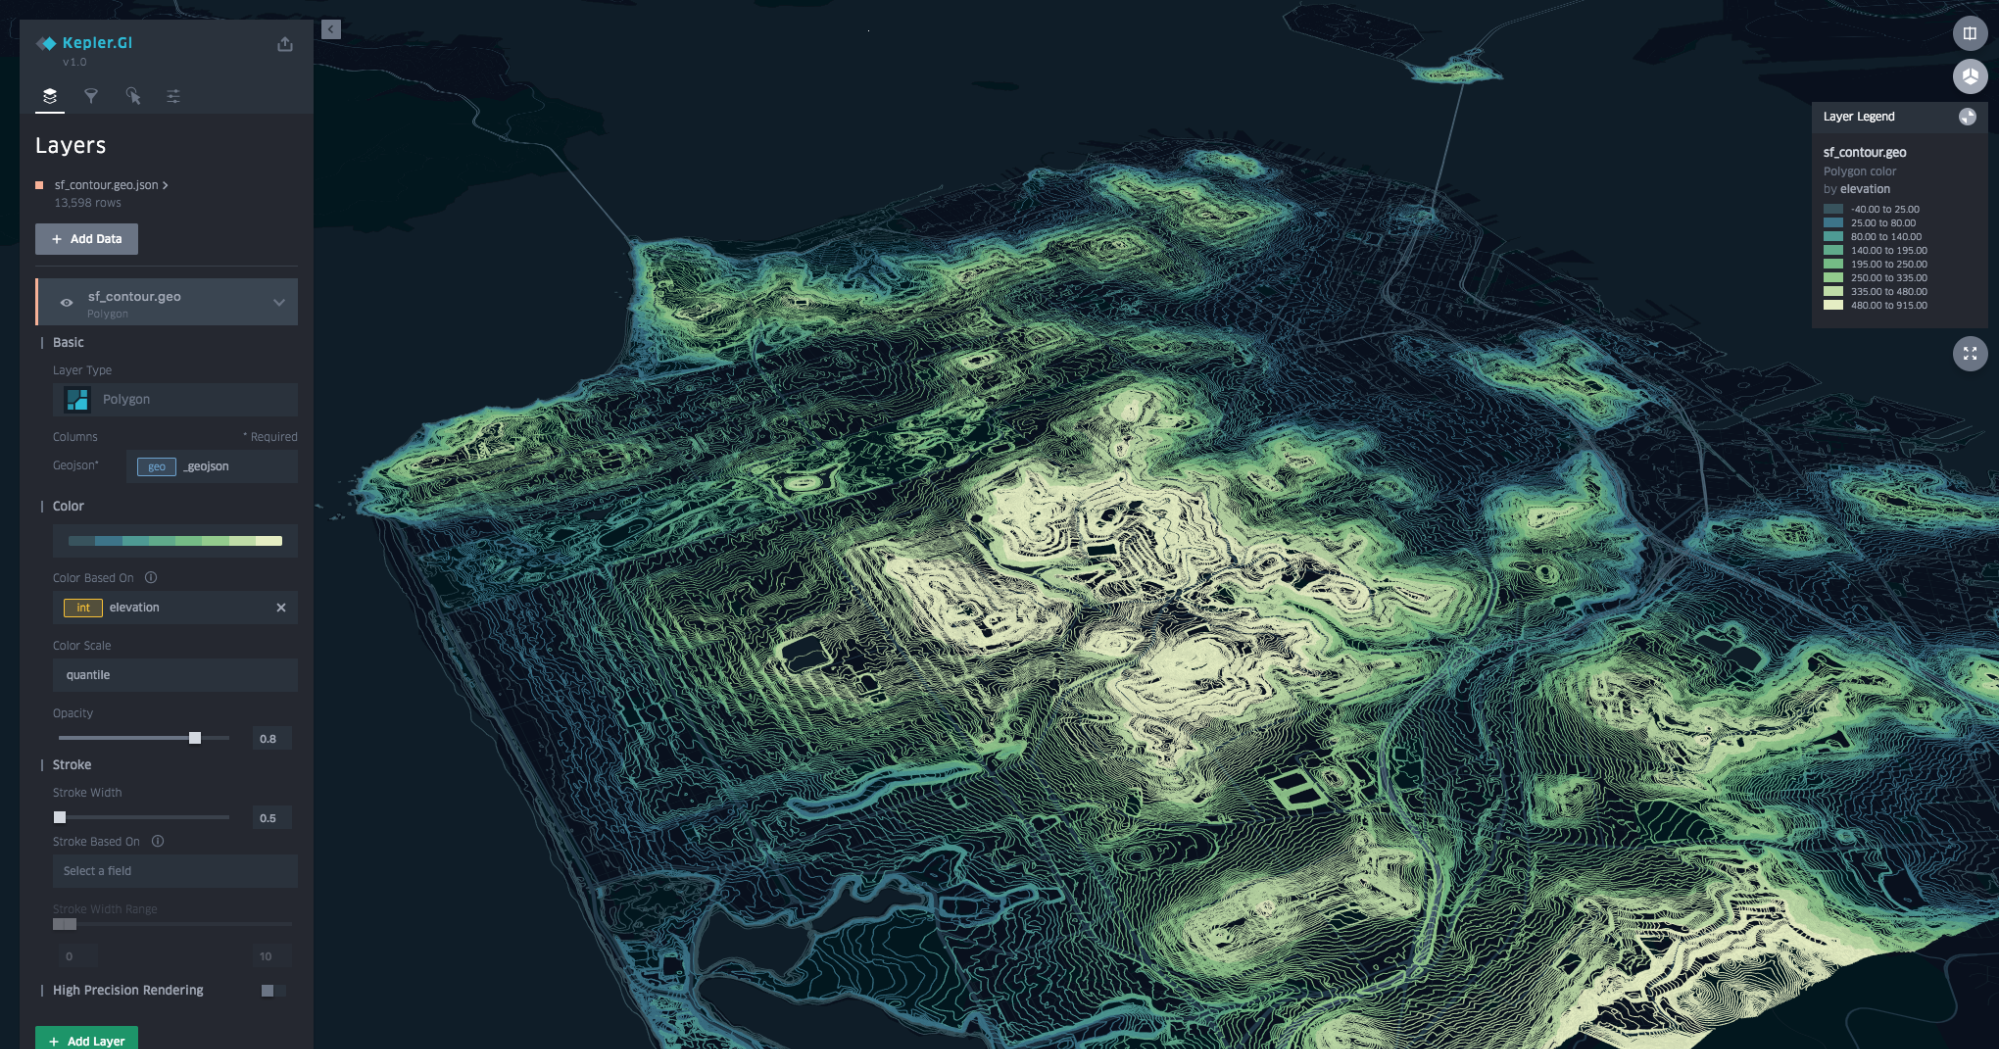
To make it easier for users with a variety of experience and skill levels to create meaningful data visualizations, we are proud to announce the launch of kepler.gl, our open source geoanalytics tool. Built on top of the deck.gl WebGL data visualization framework, kepler.gl scales the map creation process by quickly gaining insights and validating visualization ideas from geospatial data. WebGL data visualization framework, kepler.gl scales the map creation process by quickly gaining insights and validating visualization ideas from geospatial data.
Source: uber.com