Optimising Prometheus 2.6.0 Memory Usage with pprof
Table of Contents
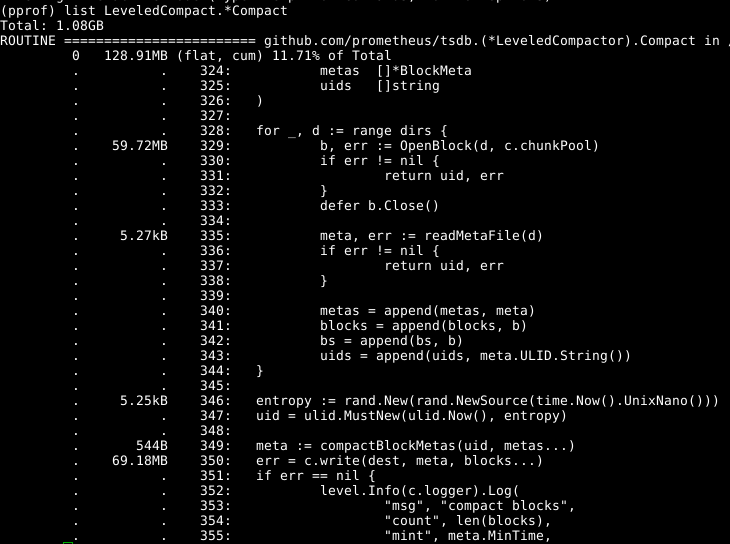
There have been some reportsthat compaction was causing larger memory spikes than was desirable. I dug into this and improved it for Prometheus 2.6.0, so let’s see how. Firstly I wrote a test setup that created some samples for 100k time series, in a way that would require compaction.
It would be nice to get the active heap usage at its peak, however we don’t know where in the code this peak is to take a profile then. Instead we’ll use the total allocations, which should at least point us in the right direction and may also spot places where we can reduce the amount of garbage generated. As before, we can take a profile with: There’s no external indication that compactions have completed, so we’ll cheat by sleeping.
We’re also working with a relatively small amount of data, so settingruntime. MemProfileRate = 256at the start of the program will track far more allocations than the default of one in every half million and make results more deterministic.
Source: robustperception.io