Performance monitoring with OpenTracing, OpenCensus, and OpenMetrics

Performance monitoring with OpenTracing, OpenCensus, and OpenMetrics

  • February 8, 2019
Table of Contents

Performance monitoring with OpenTracing, OpenCensus, and OpenMetrics

If you are familiar with instrumenting applications, you may have heard of OpenMetrics, OpenTracing, and OpenCensus. These projects aim to create standards for application performance monitoring and collecting metric data. Although the projects do overlap in terms of their goals, they each take a different approach to observability and instrumentation.

In this post, we’ll provide an introduction to all three projects, along with some key differentiators of each, and how they best support application monitoring. OpenMetrics aims to create a standard format for exposing metric data, while OpenTracing and OpenCensus focus on creating a standard for distributed tracing. Because the OpenCensus and OpenTracing projects share similar goals, there is a lot of overlap with their tracing APIs.

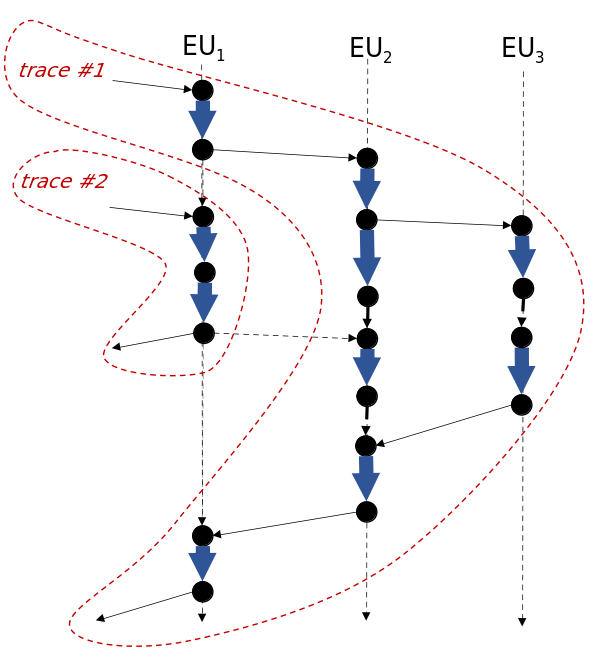
They both employ a standard for tracking requests across process boundaries so you can visualize all the operations (e.g., database calls, caching) that go into fulfilling individual requests. This enables you to monitor application performance with one of the several backends (e.g., Datadog, Zipkin) that OpenTracing or OpenCensus supports. OpenCensus is a part of the Google Open Source community, and OpenTracing and OpenMetrics are Cloud Native Computing Foundation (CNCF) projects.

The OpenCensus and OpenTracing projects use similar mechanisms, though they refer to them in different terms:

Source: datadoghq.com

Share :
comments powered by Disqus

Related Posts

Deployment strategies for the Jaeger Agent

Deployment strategies for the Jaeger Agent

If you’ve been following the evolution of the Kubernetes templates for Jaeger, you might have noticed an important change recently: the Jaeger Agent is not being deployed as a DaemonSet anymore. Instead, instructions are now being provided on how to deploy it as a “Sidecar”. The Agent component was developed to act as a “buffer” between the tracer and the collector.

Read More
Open for event based tracing?

Open for event based tracing?

In OpenTracing the fundamental concept for representing distributed traces is the (time) span: something that starts and then finishes, can be annotated with key-value pairs and can be “causally” related. This representation gained popularity with Google’s Dapper paper and triggered open-source tracing implementations like Zipkin and Jaeger and eventually the OpenTracing specification, but according to the academic literature it is not the only one. In spite its popularity, the span based trace representation has some shortcomings that limit its applicability.

Read More
Help! Something is wrong with my Jaeger installation!

Help! Something is wrong with my Jaeger installation!

Jaeger is composed of different components, each potentially running in its own host. It might be the case that one of these moving parts isn’t working properly, causing spans to not be processed and stored. When something goes wrong, make sure to check the items listed here.

Read More