Kubernetes Metrics and Monitoring
Table of Contents
This post explores the current state of metrics and monitoring in Kubernetes by walking through the gradual thought process that I experienced when learning this topic. Kubernetes needs some metrics for it’s basic out-of-the-box functionality, like autoscaling and scheduling. This is regardless of any monitoring solution you may want for the purpose of troubleshooting and alerting.
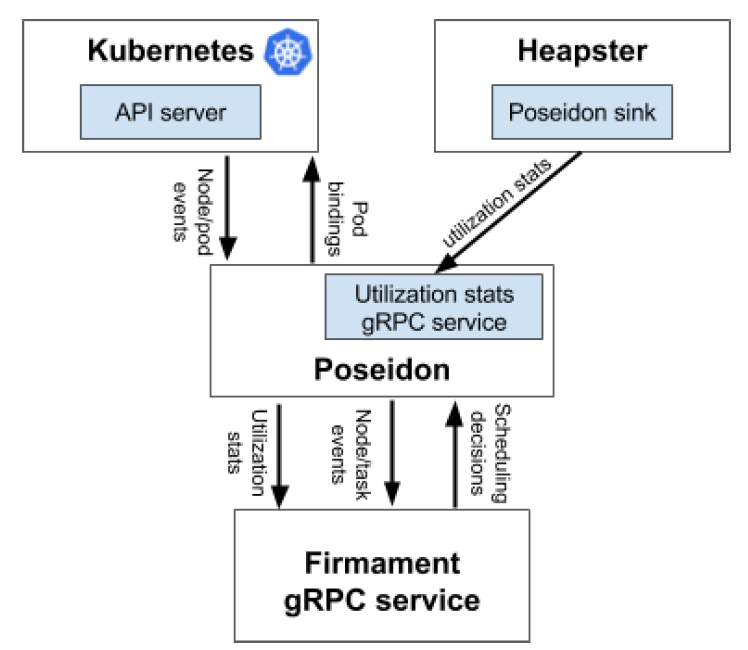
The case for Kubernetes is often being referred to as the ‘core metrics pipeline’ in contrast to a general monitoring solution. Heapster was a cluster wide resource aggregator that Kubernetes depended on which is now deprecated. Kubernetes introduced a new API for describing metrics – the ‘Metrics API’.
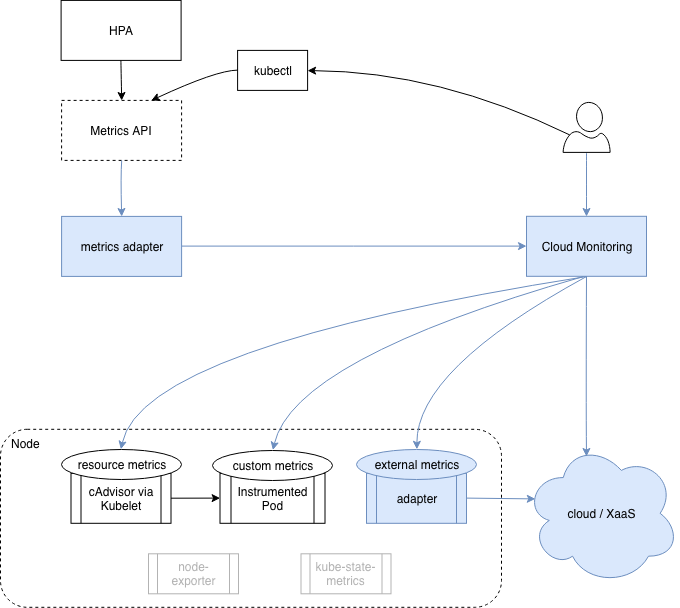
This is just a spec, not an implementation. Implementors provide a webserver that adheres the the spec, which is incorporated into the Kubernetes API by leveraging Kubernetes API aggregation. The spec describes the following types of metrics: Resource metrics:
Resource usage metrics for pods and nodes (e.g. CPU for a pod). Custom metrics: Arbitrary metrics for Kubernetes objects (e.g. requests for a service). External metrics: Metrics unrelated to Kubernetes that you still want to incorporate into the Kubernetes core metrics pipeline.
Source: itaysk.com