Accelerating Uber’s Self-Driving Vehicle Development with Data
Table of Contents
A key challenge faced by self-driving vehicles comes during interactions with pedestrians. In our development of self-driving vehicles, the Data Engineering and Data Science teams at Uber ATG (Advanced Technologies Group) contribute to the data processing and analysis that help make these interactions safe.
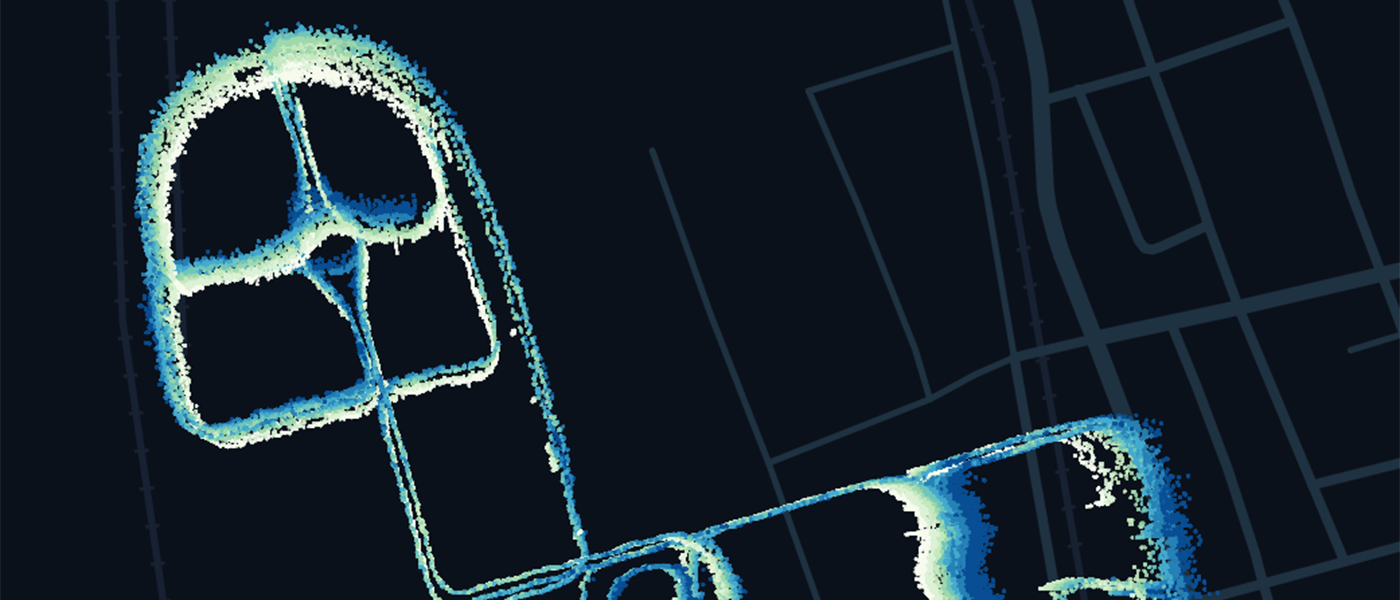
Through data, we can learn the movement of cars and pedestrians in a city, and train our self-driving vehicles how to drive. We map pedestrian movement in cities with LiDAR-equipped cars, search video collected from the roads for interesting, real-life situations that can be used in model training, build and report on simulations, and test on both a closed track and real roads to reinforce our training. Figure 1.
Uber ATG leverages data-driven insights to ensure that our technologies facilitate safe interactions between pedestrians and self-driving vehicles. The computer brain of a self-driving vehicle can only understand its environment through data. Through our data collection and modeling, we strive to give our self-driving vehicles the deepest understanding of cities possible.
The Data Engineering and Data Science teams at Uber ATG play a crucial role in charging the batteries with data and powering the system with insights. To start, the Data Engineering team takes charge of collecting data from disparate sources and makes it analyzable. The Data Science team then picks up the baton to discover insights from the data.
Source: uber.com