How should pipelines be monitored?
Table of Contents
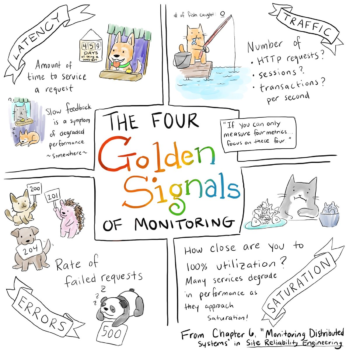
For online serving systems it’s fairly well known that you should look for request rate, errors and duration. What about offline processing pipelines though? For a typical web application, high latency or error rates are the sort of thing you want to wake someone up about as they usually negatively affect the end-user’s experience.
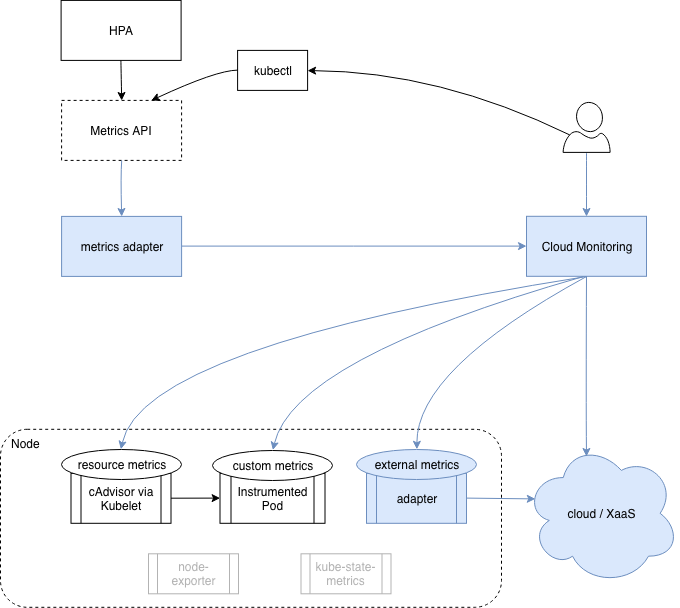
Request rate isn’t something to alert on in and of itself, however it’s important to know as it’s often related to errors/latency plus you’ll want it for capacity planning. A offline processing pipeline typically involves queues (such as Kafka) between various stages of computation. There’s no end user eagerly waiting for a web page to load, however how long it takes for data to get through is a key metric.
Similarly if data goes in but an error causes it to be dropped or otherwise not correctly processed that’s usually something to be concerned about. In addition there’s how much data is sitting in each queue, how fast data is being added, and how fast data is being removed. Many will have alerts on too much data being in a queue, and this tends to be a bit spammy.
First off any alert on a fixed threshold tends to get out of date as traffic grows, in the same way it’s better to alert on the ratio of HTTP errors to total requests rather than how many happen per second. The more serious issue however is that one queue having a certain number of items in it doesn’t mean that the overall pipeline is processing data too slowly, and setting thresholds to avoid such false positives would miss actual problems. This is typical for alerts that work off causes rather than symptoms.
Source: robustperception.io