Optimizing M3: How Uber Halved Our Metrics Ingestion Latency by Forking the Go Compiler
Table of Contents
In Uber’s New York engineering office, our Observability team maintains a robust, scalable metrics and alerting pipeline responsible for detecting, mitigating, and notifying engineers of issues with their services as soon as they occur. Monitoring the health of our thousands of microservices helps us ensure that our platform runs smoothly and efficiently for our millions of users across the globe, from riders and driver-partners to eaters and restaurant-partners. A few months ago, a routine deployment in a core service of M3, our open source metrics and monitoring platform, caused a doubling in overall latency for collecting and persisting metrics to storage, elevating the metrics’ P99 from approximately 10 seconds to over 20 seconds.
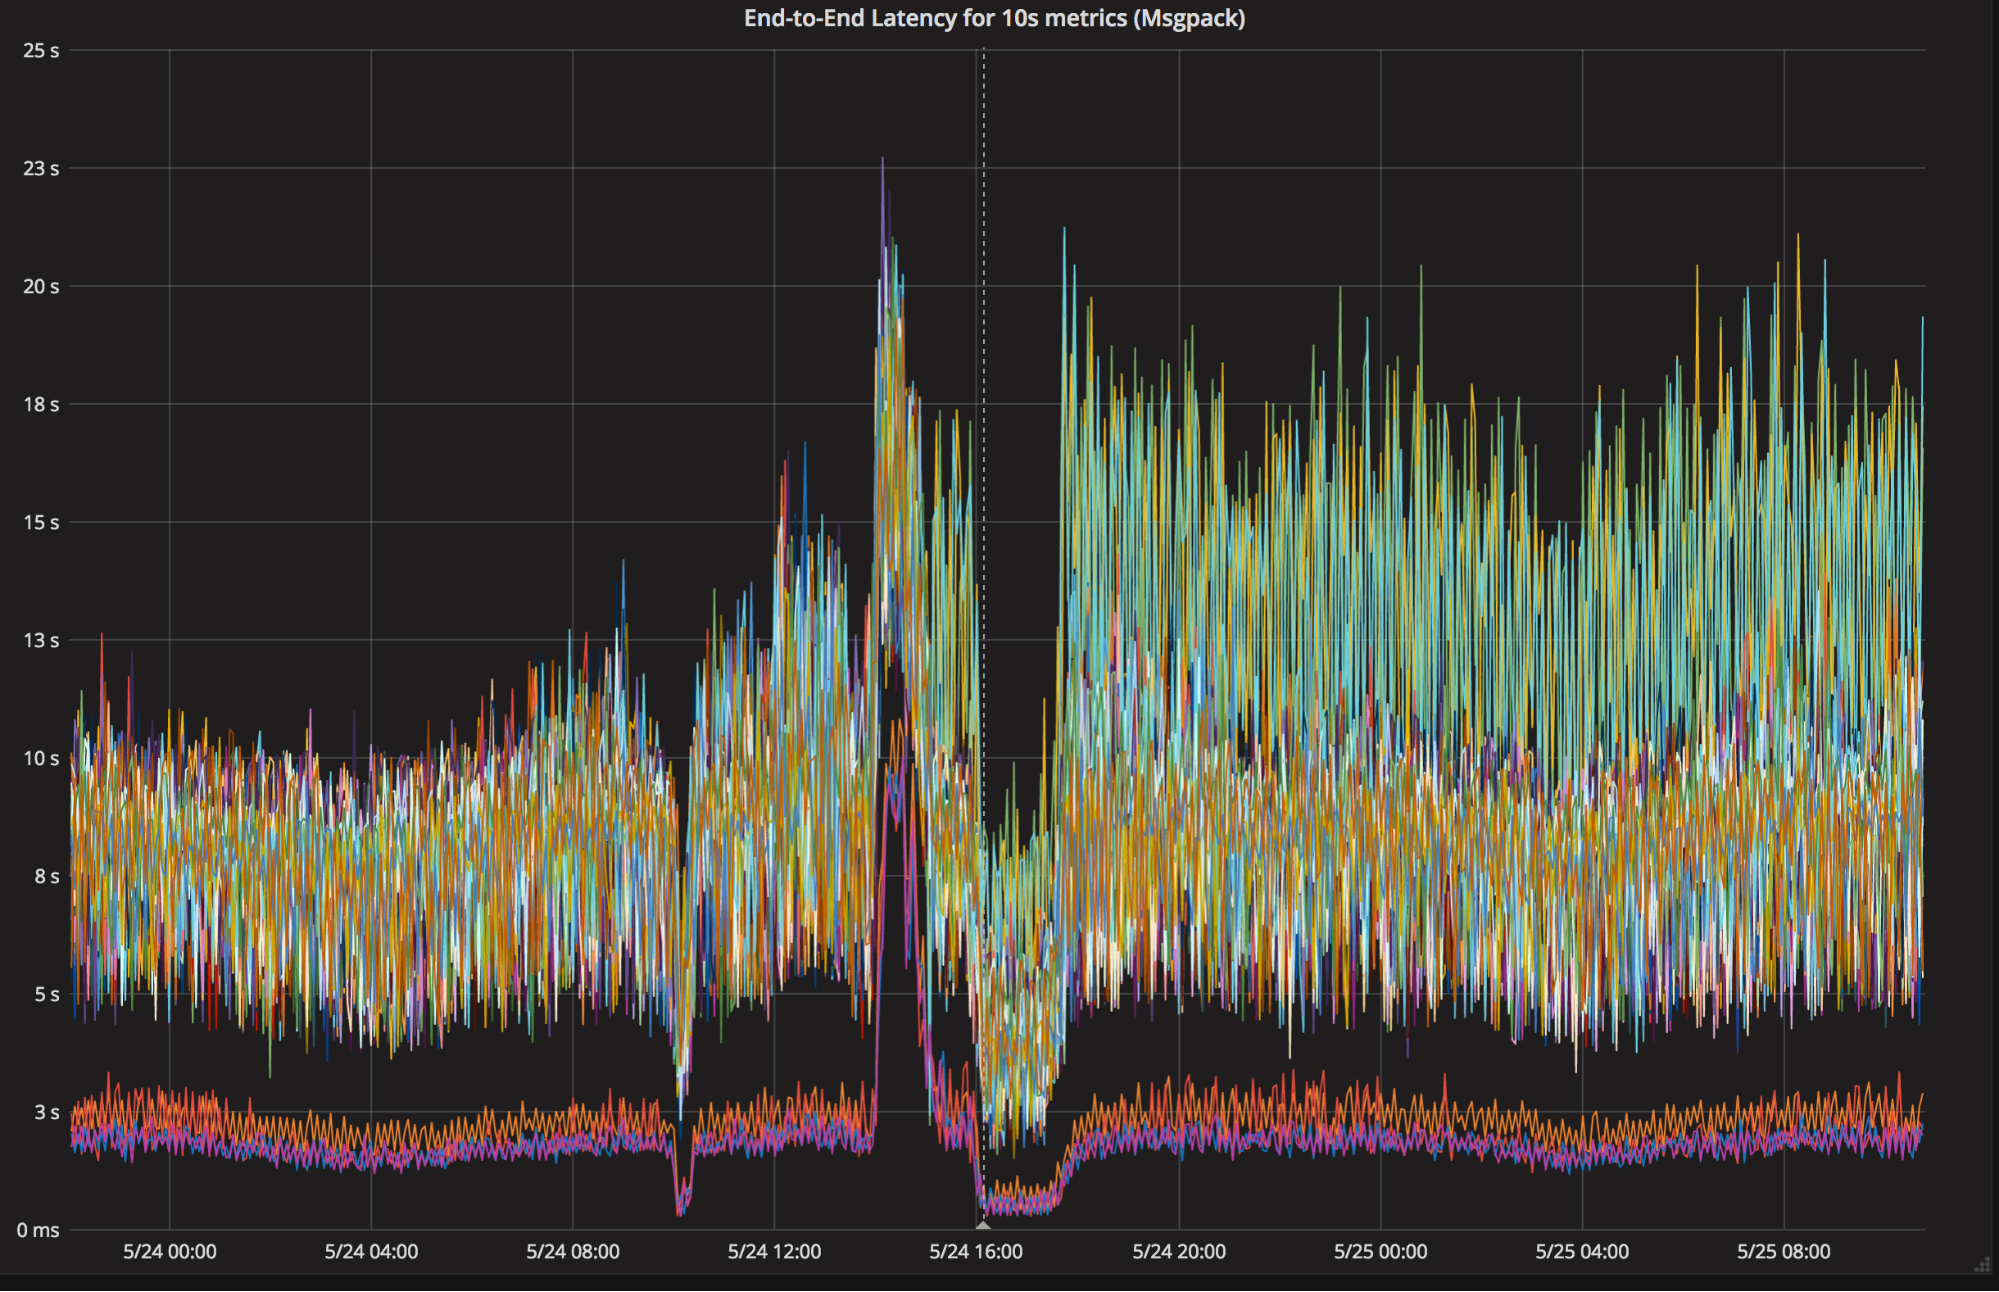
That additional latency meant that Grafana dashboards about metrics related to our internal systems would take longer to load, and our automated alerts to system owners would take longer to fire. Mitigating the issue was simple–we just reverted to the last known good build, but we still needed to figure out the root cause so we could fix it. Figure 1: The arrow on the left shows our typical end-to-end latency, hovering around 10 seconds with occasional spikes.
The arrow on the right shows our end-to-end latency after the performance regression, where we see regular spikes rising to 20 seconds. While a lot has been written about how to analyze the performance of software written in Go, most discussions conclude with an explanation of how visualizing CPU and heap profiles with pprof diagnosed and resolved the issue. In this case, our journey began with CPU profiles and pprof but quickly went off the rails when those tools failed us and we were forced to fall back on more primitive tools like git bisect, reading Plan 9 assembly, and yes, forking the Go compiler.
Source: uber.com