Understanding Envoy Proxy and Ambassador HTTP Access Logs
Table of Contents
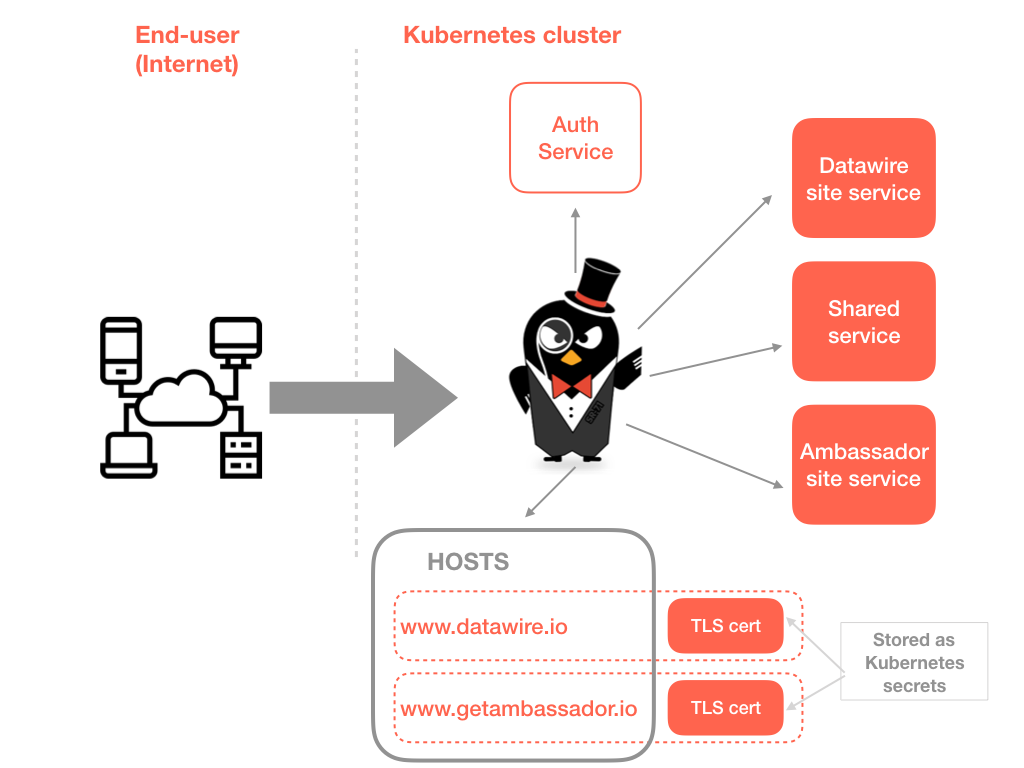
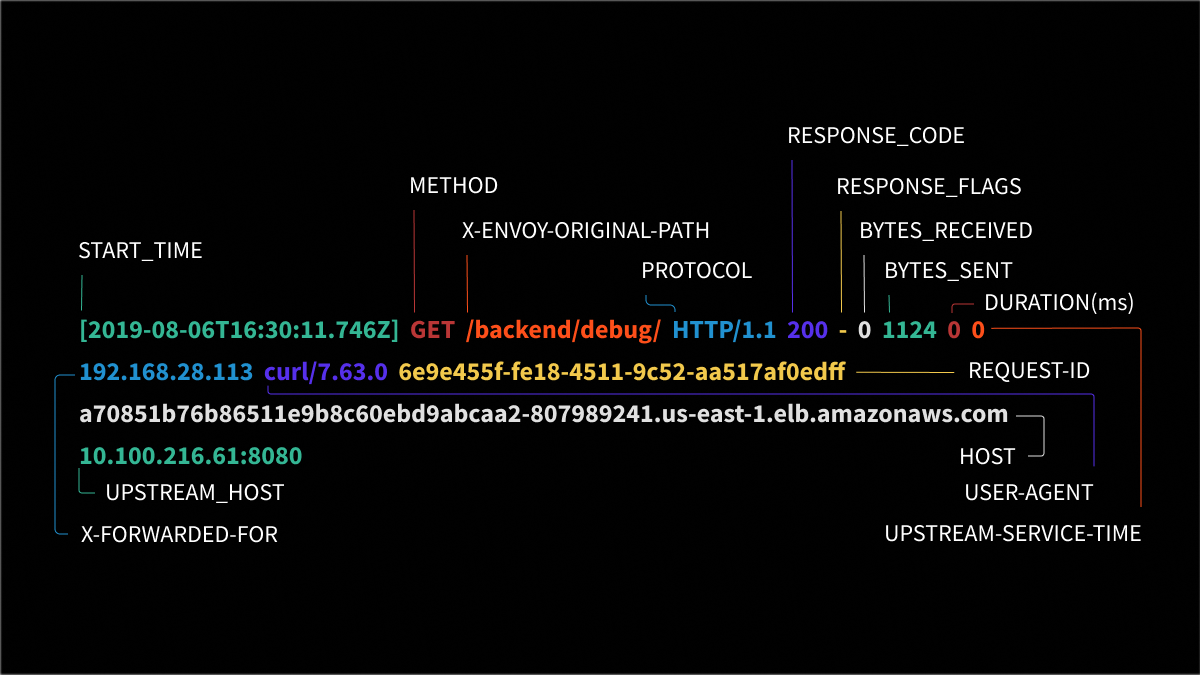
Ambassador uses Envoy Proxy as its core L7 routing engine. Envoy Proxy provides a configurable access logging mechanism. Ambassador uses the default format string for Envoy’s access logs.
These access logs provide an extensive amount of information that can be used to troubleshoot issues. These provide additional details about the response or connection if any above and beyond the standard response code. Possible values for HTTP and TCP requests include UH (no healthy upstream hosts); UF(upstream connection failure); UO (upstream overflow); NR (no route configured); URX (rejected because of upstream retry limit or maximum connection attempts reached).
For HTTP requests, an additional set of values are possible, including: DC downstream connection terminationLH Local service failed health check requestUT Upstream request timeoutLRConnection local resetURUpstream remote resetUCUpstream connection terminationDIThe request processing was delayed for a period specified via fault injection. Note that Ambassador does not currently support fault injection.
FI The request was aborted with a response code specified via fault injection. Note that Ambassador does not currently support fault injection. RL The request was ratelimited locally by the rate limiting filter.
UAEX The request was denied by the external authorization service. RLSEThe request was rejected because there was an error in rate limit service. IH
The request was rejected because it set an invalid value for a strictly-checked header in addition to 400 response code. SI Stream idle timeout in addition to 408 response code.
Source: getambassador.io