How much RAM does Prometheus 2.x need for cardinality and ingestion?
Table of Contents
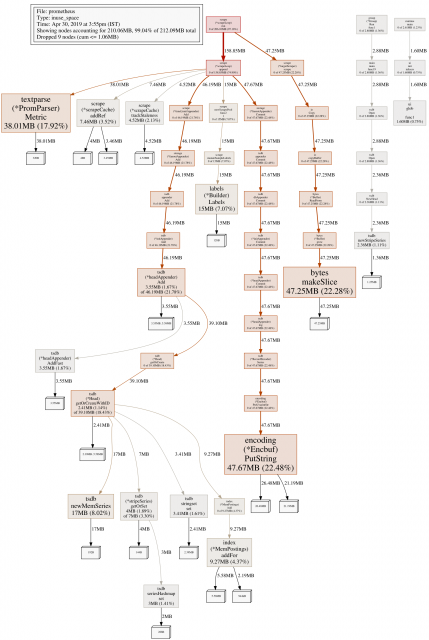
Prometheus 2.x has a very different ingestion system to 1.x, with many performance improvements. This time I’m also going to take into account the cost of cardinality in the head block. To start with I took a profile of a Prometheus 2.9.2 ingesting from a single target with 100k unique time series: This gives a good starting point to find the relevant bits of code, but as my Prometheus has just started doesn’t have quite everything.
From here I can start digging through the code to understand what each bit of usage is. So PromParser. Metric for example looks to be the length of the full timeseries name, while the scrapeCache is a constant cost of 145ish bytes per time series, and under getOrCreateWithID there’s a mix of constants, usage per unique label value, usage per unique symbol, and per sample label.
The usage under fanoutAppender.commit is from the initial writing of all the series to the WAL, which just hasn’t been GCed yet. One thing missing is chunks, which work out as 192B for 128B of data which is a 50% overhead. From here I take various worst case assumptions.
For example half of the space in most lists is unused and chunks are practically empty. To simplify I ignore the number of label names, as there should never be many of those. This works out then as about 732B per series, another 32B per label pair, 120B per unique label value and on top of all that the time series name twice.
Last, but not least , all of that must be doubled given how Go garbage collection works.
Source: robustperception.io