Troubleshooting with Kiali

Troubleshooting with Kiali

  • August 4, 2019
Table of Contents

Troubleshooting with Kiali

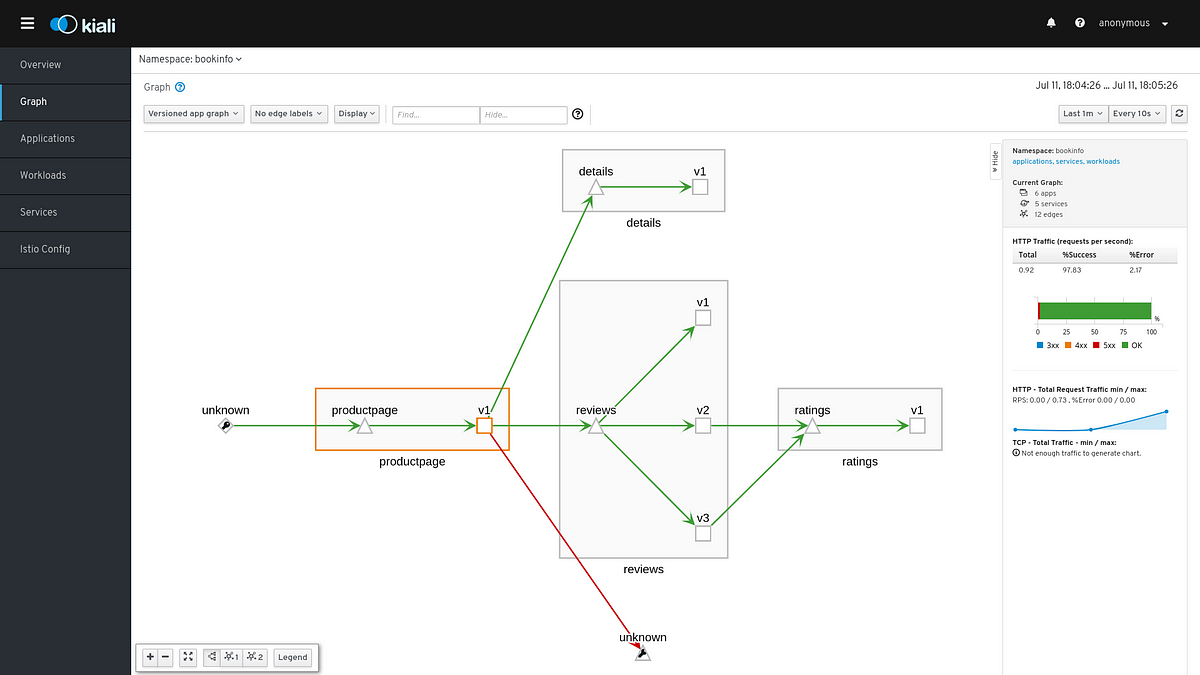
Recently I came across this excellent post from Cindy Sridharan, which throws a bunch of good ideas about how to improve the troubleshooting experience with microservices. I think that Kiali already has a good approach in that regard, which doesn’t mean there’s no room for improvement. Kiali is meant to be the Istio console.

This has been a constant focus of the development team since the beginning of the project. We try to show the best out of Istio telemetry, and to interact in various ways with the available Istio resources. However, Kiali also plays a role in troubleshooting, not just within the boundaries of the Istio mesh metrics, but also beyond.

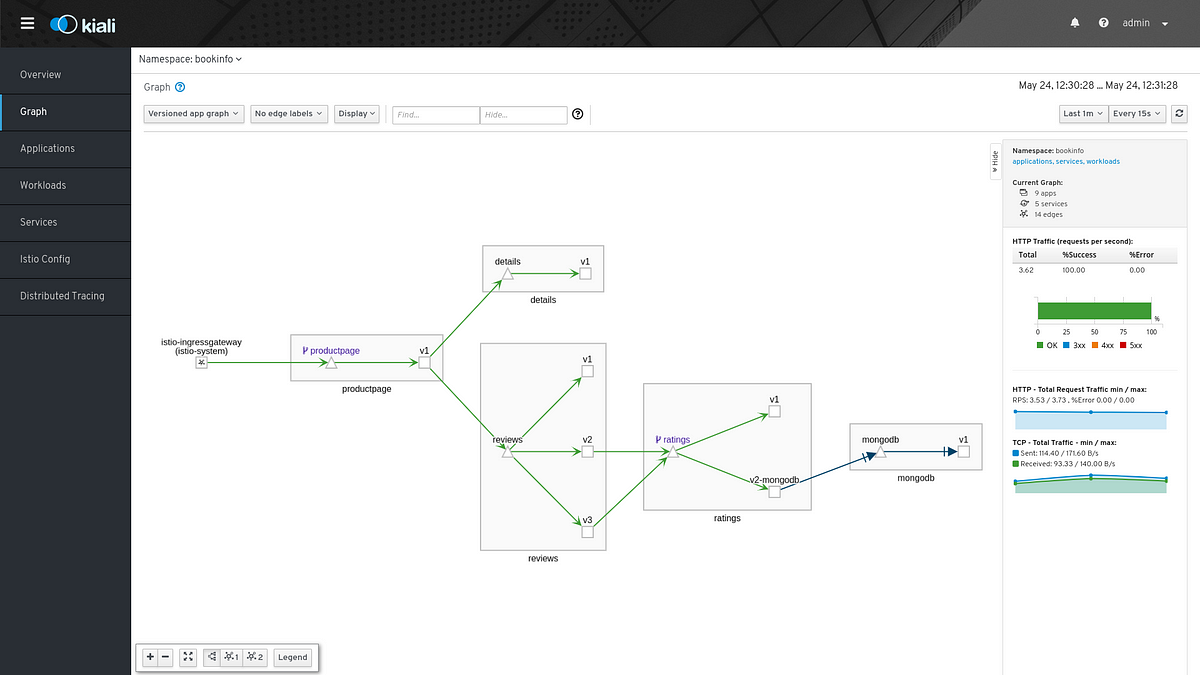
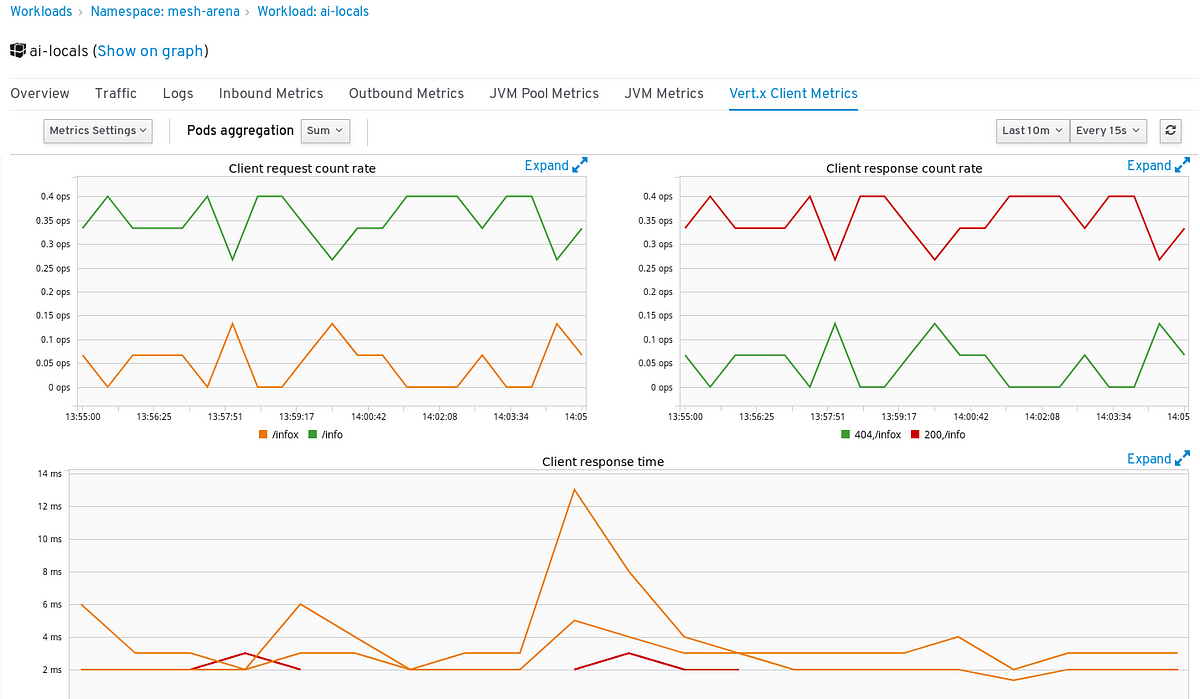
We want to help developers and operators to detect any malfunctioning service and debug them. If we can help to correlate signals coming from Istio, to other signals coming from pods and workloads, we may want to do it.

Source: medium.com

Tags :
Share :
comments powered by Disqus

Related Posts

Visualizing Istio external traffic with Kiali

Visualizing Istio external traffic with Kiali

Suppose that you have an application using several third party services to store files, send messages, write tweets, etc. It is useful to know how much traffic is going off your mesh to these services, for example, you might want to know how many requests are directed to twitter or how much data is being sent to Dropbox. Also knowing if these requests are successful or if they fail.

Read More
Jaeger integration in Kiali

Jaeger integration in Kiali

Kiali has the ability to show traces obtained from Istio. Jaeger collects traces for monitoring and troubleshooting microservices-based distributed systems, and both Istio and Kiali use the data that Jaeger provides. Originally this was done via a separate tab in the UI.

Read More