
Scaling a Mature Data Pipeline—Managing Overhead
Before delving into our specifics, I want to take a moment to discuss the technical stack backing our pipeline. Our platform uses a mixture of Spark and Hive jobs. Our core pipeline is primarily implemented in Scala.
Read More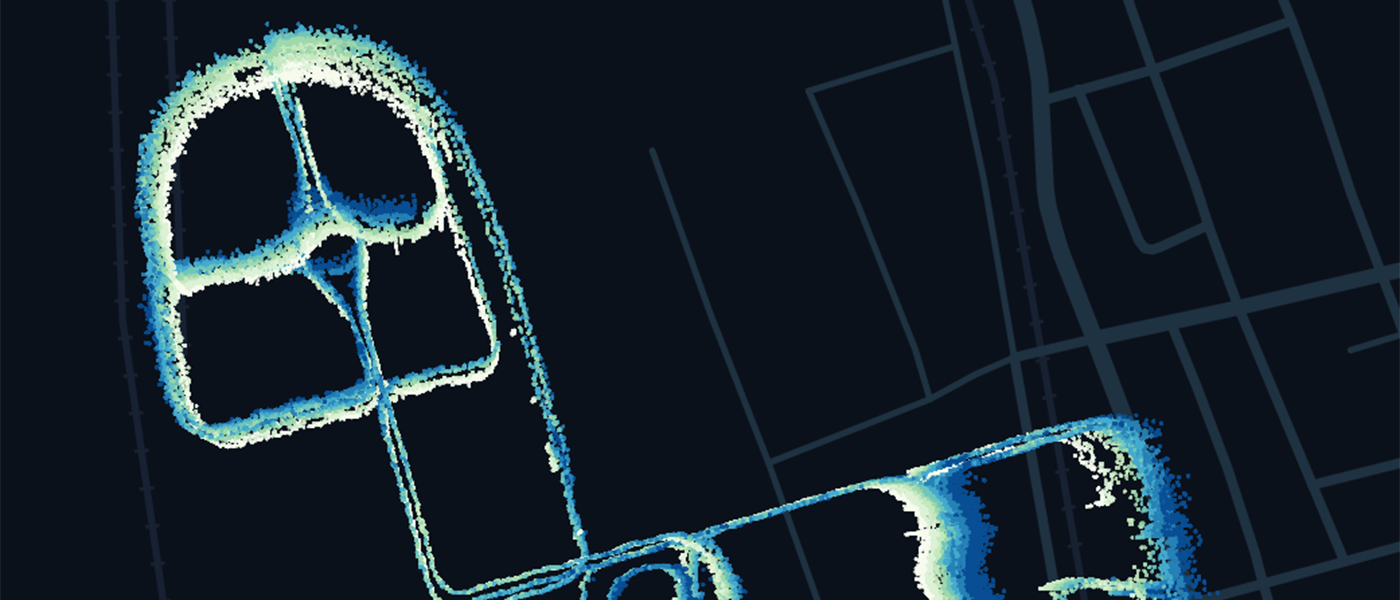
Accelerating Uber’s Self-Driving Vehicle Development with Data
A key challenge faced by self-driving vehicles comes during interactions with pedestrians. In our development of self-driving vehicles, the Data Engineering and Data Science teams at Uber ATG (Advanced Technologies Group) contribute to the data processing and analysis that help make these interactions safe.
Read MoreScio 0.7: a deep dive
Large-scale data processing is a critical component of Spotify’s business model. It drives music recommendations, artist payouts based on stream counts, and insights about how users interact with Spotify. Every day we capture hundreds of terabytes of event data, in addition to database snapshots and derived datasets.
Read More
Matplotlib—Making data visualization interesting
Data visualization is a key step to understand the dataset and draw inferences from it. While one can always closely inspect the data row by row, cell by cell, it’s often a tedious task and does not highlight the big picture. Visuals on the other hand, define data in a form that is easy to understand with just a glance and keeps the audience engaged.
Read More
Python Data Visualization 2018: Why So Many Libraries?
This post is the first in a three-part series on the state of Python data visualization tools and the trends that emerged from SciPy 2018.By James A. BednarAt a special session of SciPy 2018 in Austin, representatives of a wide range of open-source Python visualization tools shared their visions for the future of data visualization in Python. We heard updates on Matplotlib, Plotly, VisPy, and many more. I attended SciPy 2018 as a representative of PyViz, GeoViews, Datashader, Panel, hvPlot and Bokeh, and my Anaconda colleague Jean-Luc Stevens attended representing HoloViews.
Read More

Altair: Declarative Visualization in Python
With Altair, you can spend more time understanding your data and its meaning. Altair’s API is simple, friendly and consistent and built on top of the powerful Vega-Lite visualization grammar. This elegant simplicity produces beautiful and effective visualizations with a minimal amount of code.
Read More
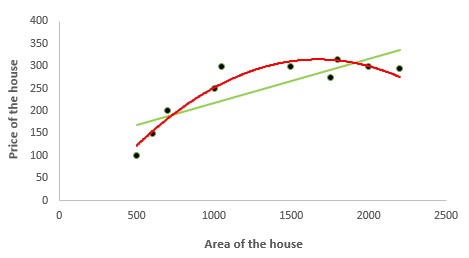
15 Types of Regression you should know
Regression techniques are one of the most popular statistical techniques used for predictive modeling and data mining tasks. On average, analytics professionals know only 2-3 types of regression which are commonly used in real world. They are linear and logistic regression.
Read More