
Telltale: Netflix Application Monitoring Simplified
Our Netflix teams need to quickly detect, diagnose, and remediate problems. Telltale is intelligent monitoring and intelligent alerting. The Telltale application health model yields intelligent monitoring and intelligent alerting.
Read More
How should pipelines be monitored?
For online serving systems it’s fairly well known that you should look for request rate, errors and duration. What about offline processing pipelines though? For a typical web application, high latency or error rates are the sort of thing you want to wake someone up about as they usually negatively affect the end-user’s experience.
Read More
MTTR is dead, long live CIRT
The game is changing for the IT ops community, which means the rules of the past make less and less sense. Organizations need accurate, understandable, and actionable metrics in the right context to measure operations performance and drive critical business transformation. The more customers use modern tools and the more variation in the types of incidents they manage, the less sense it makes to smash all those different incidents into one bucket to compute an average resolution time that will represent ops performance, which is what IT has been doing for a long time.
Read More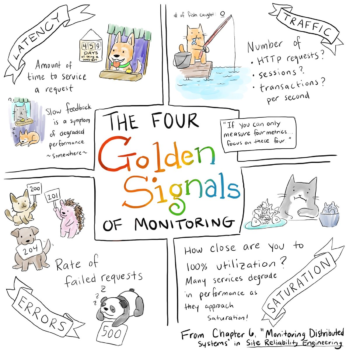
How to monitor Golden signals in Kubernetes
What are Golden signals metrics? How do you monitor golden signals in Kubernetes applications? Golden signals can help to detect issues of a microservices application.
Read More
Infrastructure monitoring: Defense against surprise downtime
Infrastructure monitoring is an integral part of infrastructure management. It is an IT manager’s first line of defense against surprise downtime. Severe issues can inject considerable downtime to live infrastructure, sometimes causing heavy loss of money and material.
Read More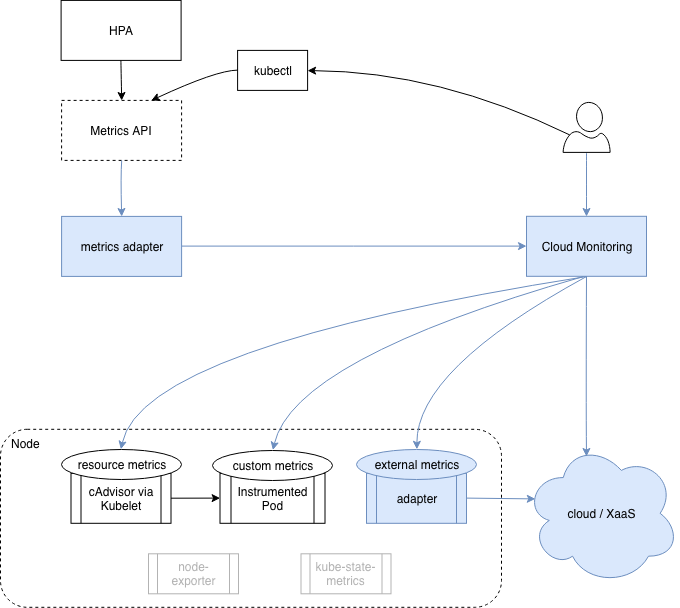
Kubernetes Metrics and Monitoring
This post explores the current state of metrics and monitoring in Kubernetes by walking through the gradual thought process that I experienced when learning this topic. Kubernetes needs some metrics for it’s basic out-of-the-box functionality, like autoscaling and scheduling. This is regardless of any monitoring solution you may want for the purpose of troubleshooting and alerting.
Read More
How Uber Monitors 4,000 Microservices
With 4,000 proprietary microservices and a growing number of open source systems that needed to be monitored, by late 2014 Uber was outgrowing its usage of Graphite and Nagios for metrics. They evaluated several technologies, including Atlas and OpenTSDB, but the fact that a growing number of open source systems were adding native support for the Prometheus Metrics Exporter format tipped the scales in that direction. Uber found with its use of Prometheus and M3, Uber’s storage costs for ingesting metrics became 8.53x more cost effective per metric per replica.
Read More
Monitoring Kubernetes, part 1: the challenges + data sources
Our industry has long been relying on microservice-based architecture to deliver software faster and safer. The advent and ubiquity of microservices naturally paved the way for container technology, empowering us to rethink how we build and deploy our applications. Docker exploded onto the scene in 2013, and, for companies focusing on modernizing their infrastructure and cloud migration, a tool like Docker is critical to shipping applications quickly, at scale.
Read More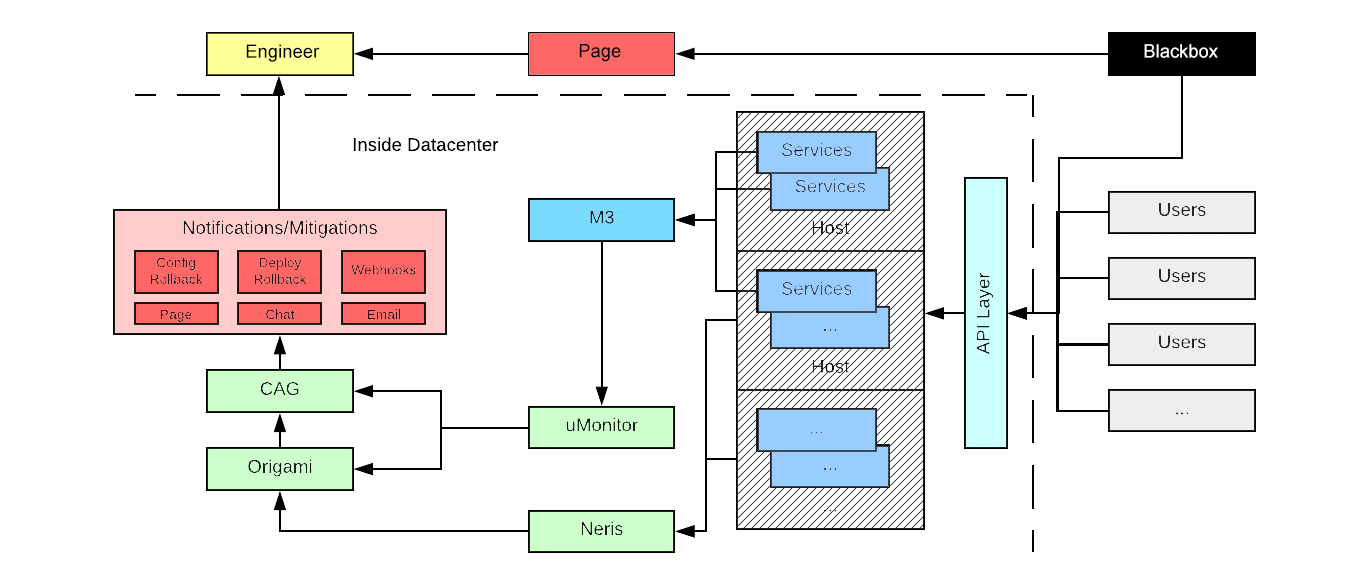
Observability at Scale: Building Uber’s Alerting Ecosystem
Uber’s software architectures consists of thousands of microservices that empower teams to iterate quickly and support our company’s global growth. These microservices support a variety of solutions, such as mobile applications, internal and infrastructure services, and products along with complex configurations that affect these products at city and sub-city levels. To maintain our growth and architecture, Uber’s Observability team built a robust, scalable metrics and alerting pipeline responsible for detecting, mitigating, and notifying engineers of issues with their services as soon as they occur.
Read More
Stack Overflow: How We Do Monitoring
What is monitoring? As far as I can tell, it means different things to different people. But we more or less agree on the concept.
Read More

M3: Uber’s Open Source Large-Scale Metrics Platform for Prometheus
M3, Uber’s open source metrics platform for Prometheus, facilitates scalable and configurable multi-tenant storage for large-scale metrics. To facilitate the growth of Uber’s global operations, we need to be able to quickly store and access billions of metrics on our back-end systems at any given time. As part of our robust and scalable metrics infrastructure, we built M3, a metrics platform that has been in use at Uber for several years now.
Read More
Introducing Thanos: Prometheus at Scale
Prometheus’s simple and reliable operational model is one of its major selling points. However, past a certain scale, we’ve identified a few shortcomings. To resolve those, we’re today officially announcing Thanos, an open source project by Improbable to seamlessly transform existing Prometheus deployments in clusters around the world into a unified monitoring system with unbounded historical data storage.
Read More